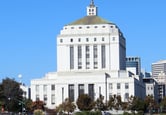
MANHATTAN (CN) – In the quiet neighborhood of Floral Park, Queens, one gated community weathered two historic New York City blackouts, power intact, thanks to an exclusive amenity in its hangar-style basement.
The North Shore Towers complex boasted private access to a natural-gas plant built on diesel engines installed in the early 1970s, capable of supplying up to 7,500 kilowatts of energy and operated by GI Energy.
If the most recent publicly available data from New York City is to believed, however, this luxury came with an enormous carbon footprint. A spreadsheet from Mayor’s Office on Sustainability says North Shore Towers spewed more than 20.9 million metric tons of carbon dioxide in 2016, more than seven times the 2.7 million metric tons of CO2 emissions reported that year by New York’s public utility, Con Edison.
As New York is set to put price tags now on greenhouse gas emissions, part of a stimulus package heralded as the Green New Deal, emissions of this size could devastate North Shore Towers.
There’s just one problem. “The number is way off,” Bob Vogel, from the management company at North Shore Towers, said in an interview.
Sal Castro, the chief engineer at the co-op, tried earlier this month to call attention to the glitch.
Emailing an administrator at Energy Star’s Portfolio Manager, a federal program launched by the U.S. Environmental Protection Agency, Castro noted that the database appears to have misinterpreted the abbreviation MCF. While commonly accepted in the industry to denote a thousand cubic feet, the database read the “M” as a million.
“I still believe there is an error in the way the system multiplies MCF to get to BTU’s,” Castro wrote to the administrator on May 1, using an abbreviation for British thermal units. “I think factor may be off by 1000. But I am OK for now if no one else notices.”

In fact, the grossly inflated data point sticks out like a sore thumb on a public spreadsheet listing more than 11,000 New York City buildings larger than 50,000 square feet.
Former Mayor Michael Bloomberg mandated the creation of this database a decade ago in signing Local Law 84, part of a larger package known as the Greener, Greater Buildings Plan in 2009. Putting a wealth of information onto New York City’s Open Data Portal, this legislation allowed journalists, academics, researchers and any others so inclined to access the energy-use information of tens of thousands of the city’s largest buildings. The user-friendly presentation could then be sorted, filtered, analyzed and mapped, instantly.
For more than a decade, this system relied on self-reporting, and North Shore Towers held the mantle in 2016, the most recent year for which data is available, as the dirtiest building by far in any of the five boroughs. Every Manhattan property combined in the same data set emitted a combined total of 24.2 million metric tons of carbon dioxide.
The Mayor’s Office of Sustainability independently corroborated that North Shore Towers’ actual emissions are much more in line with a property of its size, which includes three 34-story residential towers, an 18-hole golf course, a movie theater and other amenities.
On-call power is critical for the co-op to cater to the medical needs of its elderly residents, and the in-house gas plant kept the lights on at the sprawling complex through the great blackouts of 1977 and 2003.
But the experience of this gated community points to a broader concern.
An Energy Star support staffer explained to Castro why the database uses terminology at odds with many in the industry.
“We needed to pick one standard for consistency,” staffer Matt Yearword wrote to Castro.