 Search Articles

MANHATTAN (CN) – NASA paid tribute to its two-decade-old satellite program this week, sharing six stories of how the view from space has furthered its work.
Since the introduction of NASA’s satellite program in 1997, scientists have used aerial views “to study changes in animal habitats, track disease outbreaks, monitor forests and even help discover a new species,” a recent post on the agency’s website says.
One highlight of the feature is a data visualization that shows fluctuations in the Earth’s land and sea vegetation as seen from space between September 1997 and September 2017.
NASA likened the effect to watching Earth breathe.
Satellites including SeaWiFS contributed the data for the visualization, along with the NASA/NOAA Visible Infrared Imaging Radiometer Suite and the Moderate Resolution Imaging Spectroradiometer.
Low vegetation shows as brown land on the map, while dark green indicates an abundance.
On the ocean surface, “phytoplankton are indicated on a scale from purple (low) to yellow (high),” NASA explained.
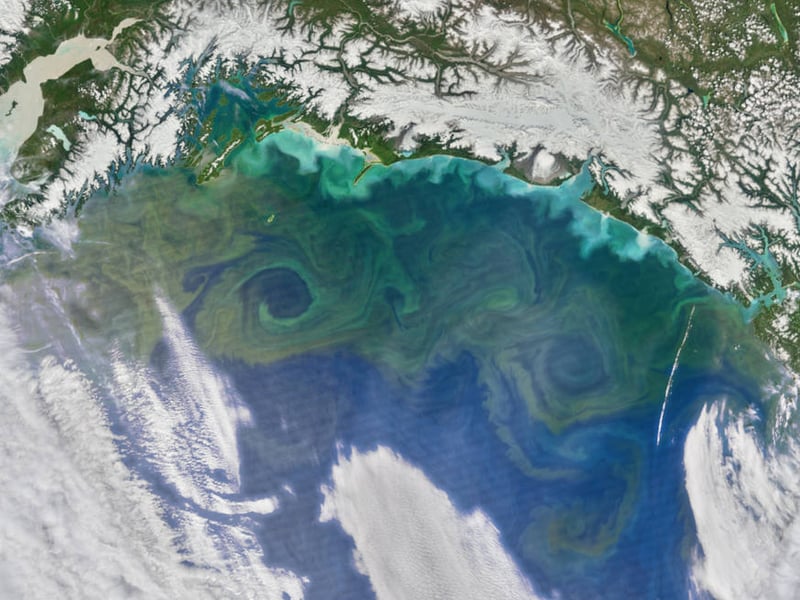
NASA also featured an image of abundant phytoplankton, known as a bloom, as swirls of green in the Gulf of Alaska on June 9, 2016.
Phytoplankton are “responsible for the only long-term transfer of carbon dioxide from Earth’s atmosphere to the ocean,” NASA explained.
“Even small changes in phytoplankton populations can affect carbon dioxide concentrations in the atmosphere, which could ultimately affect Earth’s global surface temperatures,” its post continues. “Scientists have been observing global phytoplankton populations since 1997 starting with the Sea-Viewing Wide Field-of View Sensor (SeaWiFS). They continue to study the small life-forms by satellite, ships and aircrafts.”
NASA also credited its satellites with predicting cholera bacteria outbreaks.
“While NASA satellite sensors can’t detect the actual bacteria, scientists use various satellite data to look for the environmental conditions that the bacteria thrive in,” the agency reported. “Specifically, microbiologist Rita Colwell at the University of Maryland, College Park, and West Virginia University hydrologist Antar Jutla studied data showing air and ocean temperature, salinity, precipitation, and chlorophyll concentrations, the latter a marker for zooplankton. Anticipating where the bacteria will bloom helps researchers to mitigate outbreaks.”
NASA said Colwell and Jutla recently have used satellite precipitation data, air temperature and population maps to estimate cholera risk after major events, such as severe storms.
Two maps that NASA posted with the feature show the team’s predicted cholera risk in Haiti two weeks after Hurricane Matthew hit over October 1-2, 2016, and the actual reported cholera cases in October 2016.
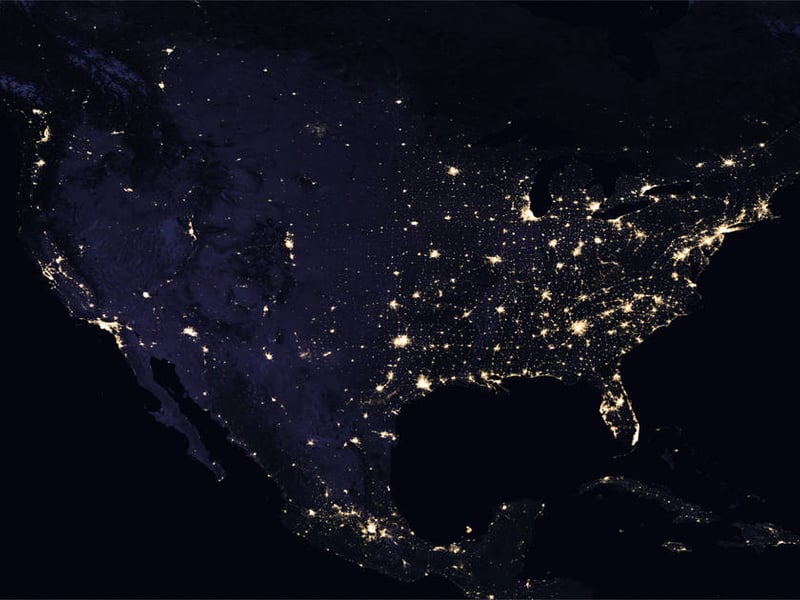
NASA dubbed another striking image in its feature Black Marble.
“Looking at trends in our lights at night, scientists can study how cities develop over time, how lighting and activity changes during certain seasons and holidays, and even aid emergency responders during power outages caused by natural disasters,” the post states.
Satellite data is also critical to scientific study of the Earth’s vulnerable coral reef ecosystem.
“Receiving sustenance from photosynthetic plankton living within their calcium carbonate structures, coral reefs provide food and shelter for many other marine life, protect shorelines from storms and waves, serve as a source for potential medicines, and operate as some of the most diverse ecosystems on the planet,” NASA said.
Because climate change has a devastating effect on coral reefs, however, NASA said it has used its satellites “to capture space views of the temperature of ocean waters surrounding coral reef systems around the world to document threats to reefs from warming seas, a phenomenon known as coral bleaching.”
Bird guano is extolled in NASA’s satellite feature as well. The agency says it uses satellite imagery of the exrement to track Antarctica’s emperor penguin populations.
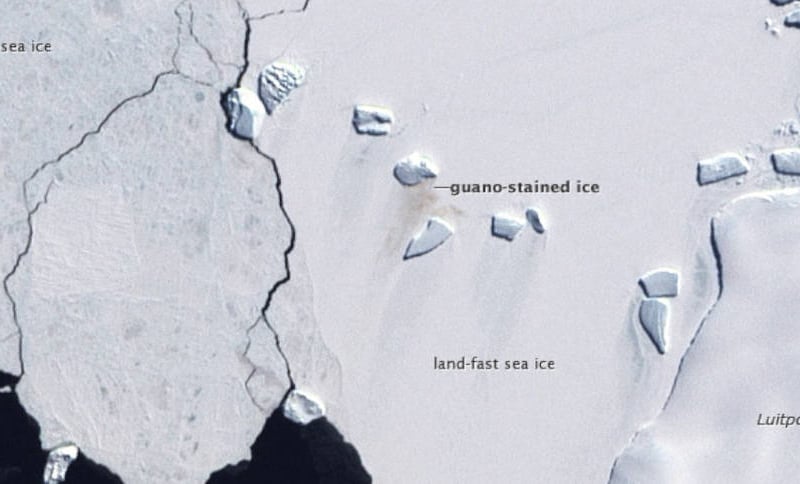
“Counting emperor penguins from the ground perspective is challenging because they breed in some of the most remote and cold places in the world, and in colonies too large to easily count manually,” the post states. “With their black and white coats, emperor penguins are also difficult to count from an aerial view as they sometimes blend in with shadows on the ice. Instead, Phil Trathan and his colleagues at the British Antarctic Survey looked through Landsat imagery for brown stains on the sea ice. By looking for penguin droppings, Trathan said his team identified 54 emperor penguin colonies along the Antarctic coast.”
Landsat images of guano have also helped Mathew Schwaller of NASA’s Goddard Space Flight Center and colleague Heather Lynch of Stony Brook University monitor Adelie penguin populations in Antarctica.
 Follow @bleonardcns
Subscribe to our free newsletters
Our weekly newsletter Closing Arguments offers the latest about ongoing trials, major litigation and rulings in courthouses around the U.S. and the world, while the monthly Under the Lights dishes the legal dirt from Hollywood, sports, Big Tech and the arts.